
287 views||Release time: Oct 17, 2025
In academic research, a figure is worth more than a thousand words—it is the visual evidence of your discovery. A clear, professional, and aesthetically pleasing graph can make the difference between a paper that is impactful and one that is overlooked. While many tools can create charts, only a few can produce the true "publication-ready" quality demanded by top-tier journals.

Two of the most powerful and popular choices among scientists and engineers are Origin and Python. But they represent two fundamentally different philosophies of data visualization. Which one is right for you?
This guide breaks down the strengths and weaknesses of both Origin and Python to help you choose the best tool for your research and create stunning, publication-grade figures.
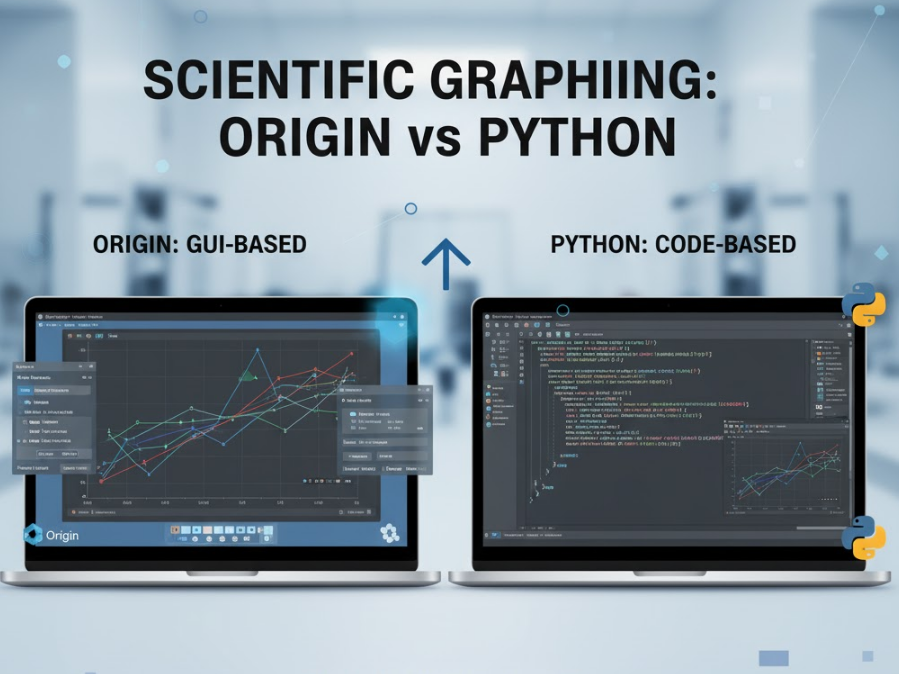
Origin, developed by OriginLab, is a comprehensive data analysis and graphing software used extensively in academia and industry. It operates with a graphical user interface (GUI), meaning you can create complex graphs by clicking through menus and dialog boxes.
Why Researchers Love Origin:
Intuitive and Easy to Learn: For those who prefer a visual, point-and-click environment, Origin is far easier to get started with than a programming language. You can create a sophisticated plot within minutes.
Powerful Built-in Analysis: Origin is more than just a graphing tool. It comes packed with advanced statistical analysis, curve fitting, peak analysis, and signal processing functions that are seamlessly integrated with its graphing capabilities.
Extensive Library of Graph Templates: Need to create a specific, complex graph type like a ternary plot, a contour profile, or a multi-panel graph? Origin has hundreds of built-in templates that you can customize.
High-Quality Output: The level of granular control over every element—tick marks, labels, legends, error bars—is exceptional, allowing you to meet the strict formatting requirements of any journal.
The Downsides of Origin:
Cost: Origin is commercial software and requires a paid license, which can be expensive for individuals without an institutional subscription.
Reproducibility: While Origin has scripting and project-saving features, reproducing a complex figure created through dozens of mouse clicks can be challenging. It's not as inherently reproducible as a code-based script.
Automation: Automating the creation of hundreds of similar graphs can be more cumbersome than writing a simple loop in a programming language.
Best for: Experimental scientists (in fields like physics, chemistry, and materials science) who need to quickly visualize and analyze datasets without writing code.
Python is a free, open-source programming language that has become a powerhouse for scientific computing and data visualization, thanks to libraries like Matplotlib, Seaborn, and Plotly.
Why Researchers Choose Python:
Completely Free and Open-Source: There are no licensing fees. Anyone can use it.
Unmatched Flexibility: If you can imagine a type of graph, you can create it in Python. You have programmatic control over every single pixel on the canvas, allowing for limitless customization.
Guaranteed Reproducibility: A Python script is a perfect, step-by-step recipe for your figure. Anyone (including your future self) can re-run the same code on the same data and produce the exact same graph. This is the gold standard for scientific transparency.
Seamless Integration: Your data analysis workflow (using libraries like NumPy and Pandas) and your visualization workflow exist in the same environment. There is no need to export and import data between different programs.
Automation is Trivial: Need to generate 100 graphs from 100 different datasets? A simple for loop in your script can do this in seconds.
The Downsides of Python:
Steep Learning Curve: For those without a programming background, there is a significant initial investment in learning the syntax of Python and the intricacies of libraries like Matplotlib.
Time-Consuming for Simple Plots: Sometimes, creating a basic plot with perfectly formatted labels and legends can require more lines of code than you might expect. A quick "look-see" plot is often faster in a GUI-based program.
Best for: Computational researchers, data scientists, and anyone who needs to automate graph creation or prioritizes the absolute reproducibility of their work.
| Feature | Origin | Python (Matplotlib/Seaborn) |
| Cost | Paid License | Free & Open-Source |
| Ease of Use | ★★★★★ (Point-and-click) | ★★☆☆☆ (Requires coding) |
| Flexibility | ★★★★☆ | ★★★★★ (Limitless) |
| Reproducibility | ★★★☆☆ | ★★★★★ (Perfect) |
| Learning Curve | Low | High |
| Built-in Analysis | Extensive | Requires other libraries (e.g., SciPy) |
The best tool depends on your background, your field, and your specific task.
Choose Origin when your priority is speed and integrated data analysis, and you prefer a user-friendly, interactive environment. It's perfect for exploring data and creating complex, one-off publication figures.
Choose Python when your priority is reproducibility, automation, and customization. It is the superior choice for computational projects and for creating a transparent, shareable workflow from raw data to final figure.
Many researchers even adopt a "best of both worlds" approach: they use Python for the heavy lifting of data processing and automation, and then export a clean dataset to Origin for final, interactive polishing of the figure for publication.